- ubuntu12.04环境下使用kvm ioctl接口实现最简单的虚拟机
- Ubuntu 通过无线网络安装Ubuntu Server启动系统后连接无线网络的方法
- 在Ubuntu上搭建网桥的方法
- ubuntu 虚拟机上网方式及相关配置详解
CFSDN坚持开源创造价值,我们致力于搭建一个资源共享平台,让每一个IT人在这里找到属于你的精彩世界.
这篇CFSDN的博客文章PHP生成图表pChart的示例解析由作者收集整理,如果你对这篇文章有兴趣,记得点赞哟.
pchart是一个开源的图表生成库,主要涉及3个class:pchart.class, pdata.class, pcache.class,可生成20多种简单或复杂的图表,支持png,jpg,gif通用图片格式。数据源可以来自于database,csv,当然也可以手写。使用该程序php需要开启gd服务,先来看看pchart的工作流程:
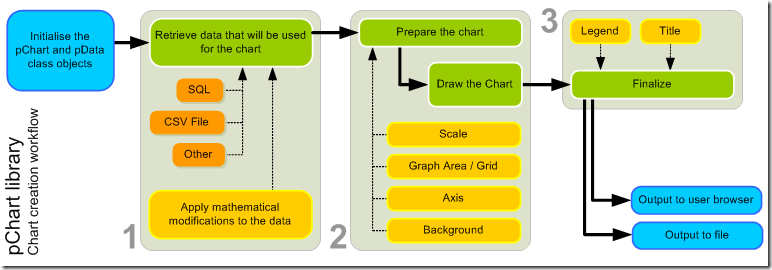
主要分为三步:
下面看一个简单的柱状图表:
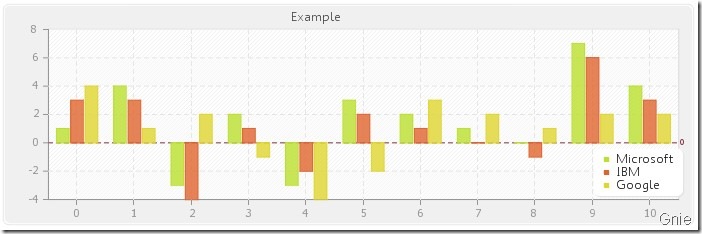
代码如下:
|
1
2
3
4
5
6
7
8
9
10
11
12
13
14
15
16
17
18
19
20
21
22
23
24
25
26
27
28
29
30
31
32
33
34
35
36
37
38
39
40
41
42
43
44
45
46
47
48
49
50
|
<?php
// standard inclusions
include
(
"pchart/pdata.class"
);
include
(
"pchart/pchart.class"
);
// dataset definition
$dataset
=
new
pdata;
//图表数据
$dataset
->addpoint(
array
(1,4,-3,2,-3,3,2,1,0,7,4),
"serie1"
);
$dataset
->addpoint(
array
(3,3,-4,1,-2,2,1,0,-1,6,3),
"serie2"
);
$dataset
->addpoint(
array
(4,1,2,-1,-4,-2,3,2,1,2,2),
"serie3"
);
$dataset
->addallseries();
$dataset
->setabsciselabelserie();
//数据图例
$dataset
->setseriename(
"microsoft"
,
"serie1"
);
$dataset
->setseriename(
"ibm"
,
"serie2"
);
$dataset
->setseriename(
"google"
,
"serie3"
);
// initialise the graph
$test
=
new
pchart(700,230);
//设置图表尺寸、样式
$test
->setfontproperties(
"fonts/tahoma.ttf"
,8);
$test
->setgrapharea(50,30,680,200);
$test
->drawfilledroundedrectangle(7,7,693,223,5,240,240,240);
$test
->drawroundedrectangle(5,5,695,225,5,230,230,230);
$test
->drawgrapharea(255,255,255,true);
$test
->drawscale(
$dataset
->getdata(),
$dataset
->getdatadescription(),scale_normal,150,150,150,true,0,2,true);
$test
->drawgrid(4,true,230,230,230,50);
// draw the 0 line
$test
->setfontproperties(
"fonts/manksans.ttf"
,6);
$test
->drawtreshold(0,143,55,72,true,true);
// draw the bar graph
//柱状图要使用drawbargraph()
$test
->drawbargraph(
$dataset
->getdata(),
$dataset
->getdatadescription(),true,80);
// finish the graph
//制作图例、标题、字体等属性
$test
->setfontproperties(
"fonts/manksans.ttf"
,10);
$test
->drawlegend(596,150,
$dataset
->getdatadescription(),255,255,255);
$test
->setfontproperties(
"fonts/manksans.ttf"
,10);
$test
->drawtitle(50,22,
"example"
,50,50,50,585);
//生成图表
$imagefile
=
"example12.png"
;
$test
->render(
$imagefile
);
echo
'<img src="'
.
$imagefile
.
'">'
;
?>
|
这个是雷达效果的:
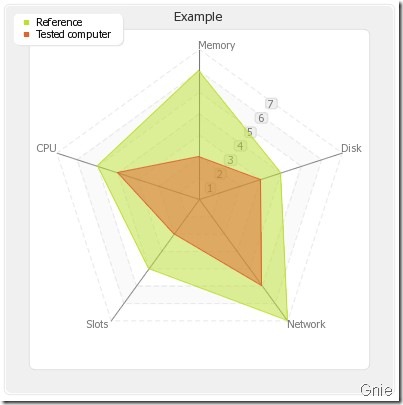
代码:
|
1
2
3
4
5
6
7
8
9
10
11
12
13
14
15
16
17
18
19
20
21
22
23
24
25
26
27
28
29
30
31
32
33
34
35
36
37
38
39
40
41
|
<?php
// standard inclusions
include
(
"pchart/pdata.class"
);
include
(
"pchart/pchart.class"
);
// dataset definition
$dataset
=
new
pdata;
$dataset
->addpoint(
array
(
"memory"
,
"disk"
,
"network"
,
"slots"
,
"cpu"
),
"label"
);
$dataset
->addpoint(
array
(6,4,7,4,5),
"serie1"
);
$dataset
->addpoint(
array
(2,3,5,2,4),
"serie2"
);
$dataset
->addserie(
"serie1"
);
$dataset
->addserie(
"serie2"
);
$dataset
->setabsciselabelserie(
"label"
);
$dataset
->setseriename(
"reference"
,
"serie1"
);
$dataset
->setseriename(
"tested computer"
,
"serie2"
);
// initialise the graph
$test
=
new
pchart(400,400);
$test
->setfontproperties(
"fonts/tahoma.ttf"
,8);
$test
->drawfilledroundedrectangle(7,7,393,393,5,240,240,240);
$test
->drawroundedrectangle(5,5,395,395,5,230,230,230);
$test
->setgrapharea(30,30,370,370);
$test
->drawfilledroundedrectangle(30,30,370,370,5,255,255,255);
$test
->drawroundedrectangle(30,30,370,370,5,220,220,220);
// draw the radar graph
//要使用drawradaraxis()生成雷达效果
$test
->drawradaraxis(
$dataset
->getdata(),
$dataset
->getdatadescription(),true,20,120,120,120,230,230,230);
$test
->drawfilledradar(
$dataset
->getdata(),
$dataset
->getdatadescription(),50,20);
// finish the graph
$test
->drawlegend(15,15,
$dataset
->getdatadescription(),255,255,255);
$test
->setfontproperties(
"fonts/tahoma.ttf"
,10);
$test
->drawtitle(0,22,
"example"
,50,50,50,400);
$imagefile
=
"example8.png"
;
$test
->render(
$imagefile
);
echo
'<img src="'
.
$imagefile
.
'">'
;
?>
|
再看几个其他的效果 。
1,饼图:
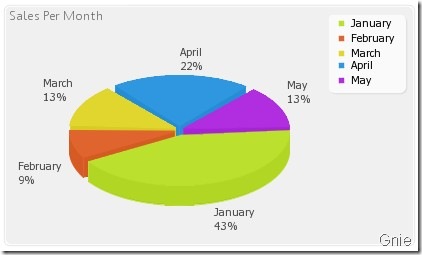
2, 双座标曲线图:
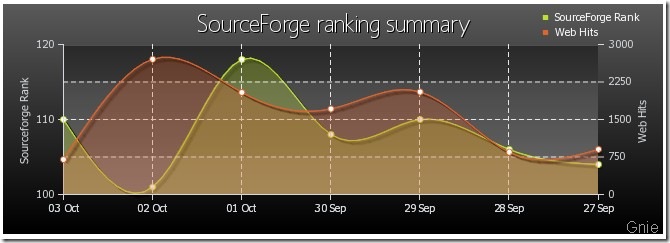
3, 层叠柱状图:
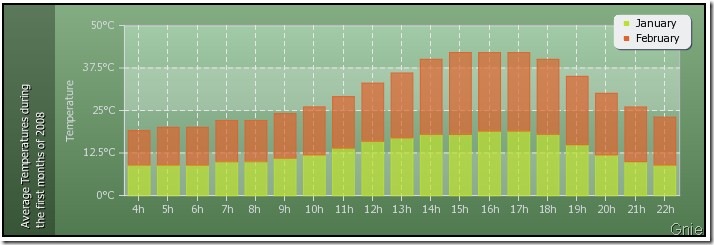
4, 多图表:
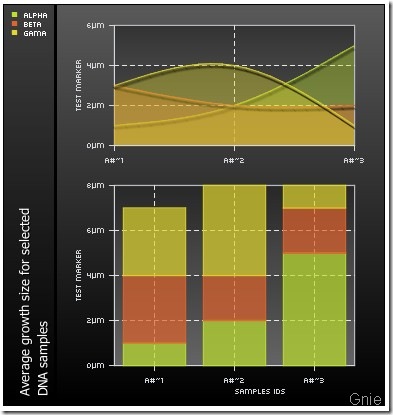
图表的种类已经相当丰富了,具体图表设置请参考 。
http://pchart.sourceforge.net/documentation.php?topic=pchart 。
到此这篇关于php生成图表pchart的示例解析的文章就介绍到这了,更多相关php生成图表pchart内容请搜索我以前的文章或继续浏览下面的相关文章希望大家以后多多支持我! 。
原文链接:https://www.cnblogs.com/gnielee/archive/2009/08/06/1540367.html 。
最后此篇关于PHP生成图表pChart的示例解析的文章就讲到这里了,如果你想了解更多关于PHP生成图表pChart的示例解析的内容请搜索CFSDN的文章或继续浏览相关文章,希望大家以后支持我的博客! 。
我希望我的 y 轴以 8 为间隔显示自动收报机。我已将缩放模式设置为手动,最小值为 0,最大值为 48,但它仍然默认为以 0 为间隔显示刻度5. 我还没有看到自定义的设置或选项,有没有办法做到这一点?
我正在用 p Chart 开发 php 饼图,看起来不错。现在我想改变每个切片的颜色。是否可以更改颜色? 最佳答案 您正在寻找的函数是 setSliceColor() - http://wiki.pc
有谁知道如何更改 pChart 中 x 轴标签的角度?我需要倾斜它们,以便在单个图表中显示更长的时间范围。 最佳答案 对于 pChart 2,可以使用 drawScale 方法的 'LabelRota
我的图表结果如下,我需要在轴名称或轴标签之间留出空格,这里需要在“月”和 x 轴标签之间留出一些空间,“点击次数”和 y 轴标签也类似。 最佳答案 尝试查找行号。 pDraw.class.php 中的
我正在尝试构建组合的散点图和折线图。目前散点图很好,当我添加线条时,它们向右旋转了 90 度,因此它们是垂直的而不是水平的。我一辈子都弄不明白为什么,所以如果有人有任何建议,那就太棒了。 下面的代码是
我在我的 php 页面中显示 3DPie 示例 pChart 时遇到问题,无论输出 (Stroke()、autoOutput()、render()) 是什么,它都不会呈现给浏览器,但示例在示例中有效文
我正在使用类似于此示例的雷达图: https://pchart.net/doc.draw.radar.html 我的数据范围从 1 分到 4 分,所以我配置了一些选项: $options = arra
我是 pchart 新手,在从 mysql 表创建图表时遇到问题(可能是我错过的问题)。我想要的只是根据我要选择的项目绘制一行图表。它只工作了一次,然后每次我尝试再次运行脚本时,apache(我使用的
我想使用 pChart 呈现样本值与日期的简单折线图。我已经掌握了基础知识,但如何处理日期中的空白?样本已按季度平均,但并非每个季度都有样本。有时它会跳过一两个季度。 目前,这些间隙在 X 轴上被一个
我正在使用以下内容: $chartImage->autoOutput('/statistics/'.$image.'.png'); 问题在于此代码将图像输出到浏览器。如果它将图像保存到具有我指定的目录
我正在尝试将一个方法的返回值分配给一个数组,然后在第二步中将该数组放入 pChart 的 addPoints() 方法中。 现在我正在使用以下代码: $dataUsage = array(); for
我尝试用 pchart 创建一个图表,我在这个链接(在官方网站)中做了这样的操作: https://wiki.pchart.net/doc.mysql.integration.html 但每次我都会收
我有一个名为“MonthReport.class.php”的类,它的结构如下所示: class MonthReport{ ..... //some member variabl
我正在使用 PChart 库,我想从 x 轴上的第 5 个索引开始绘制图表。有什么想法吗?我已经在这样做了: $myData->AddPoints(array("Jan","Feb","Mar","A
我正在尝试根据 pchart 提供的示例生成图表。这是我的代码: addPoints($Yes,"Yes"); $myData->addPoints($No,"No"); $myData->addPo
我有 RTM,但我真的不知道如何使用 strtotime 函数将日期从 UTC 转换为 unix 时间,因为我不确定哪些变量在哪里。具体代码如下: $value = $_POST["Attribute
我正在尝试将“pChart”与我的 PHP 代码集成。当我尝试运行示例时,它给我一个错误,指出 call to undefined function imagecreatetruecolor。建议的解

我是一名优秀的程序员,十分优秀!