- ubuntu12.04环境下使用kvm ioctl接口实现最简单的虚拟机
- Ubuntu 通过无线网络安装Ubuntu Server启动系统后连接无线网络的方法
- 在Ubuntu上搭建网桥的方法
- ubuntu 虚拟机上网方式及相关配置详解
CFSDN坚持开源创造价值,我们致力于搭建一个资源共享平台,让每一个IT人在这里找到属于你的精彩世界.
这篇CFSDN的博客文章Python实现机器学习算法的分类由作者收集整理,如果你对这篇文章有兴趣,记得点赞哟.
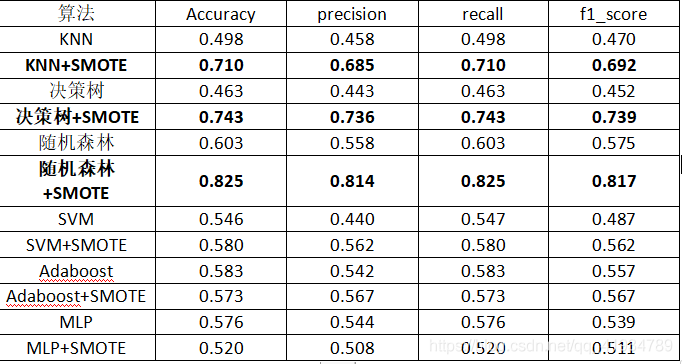
对葡萄酒数据集进行测试,由于数据集是多分类且数据的样本分布不平衡,所以直接对数据测试,效果不理想。所以使用SMOTE过采样对数据进行处理,对数据去重,去空,处理后数据达到均衡,然后进行测试,与之前测试相比,准确率提升较高.

例如:决策树:
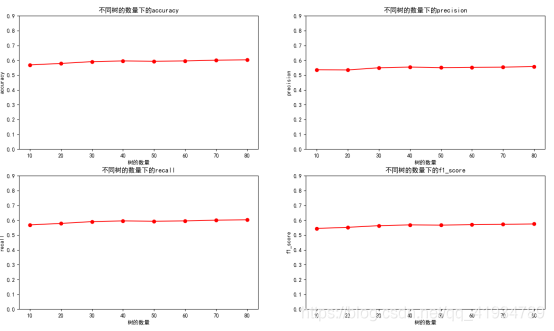
Smote处理前:

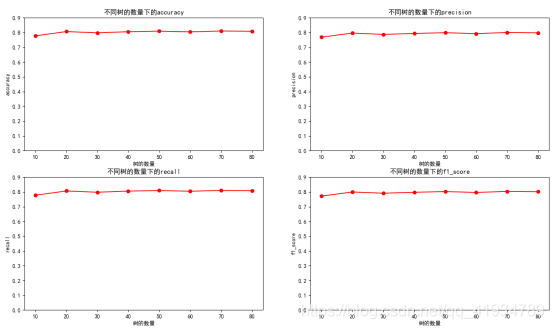
Smote处理后:

|
1
2
3
4
5
6
7
8
9
10
11
12
13
14
15
16
17
18
19
20
21
22
23
24
25
26
27
28
29
30
31
32
33
34
35
36
37
38
39
40
41
42
43
44
45
46
47
48
49
50
51
52
53
54
55
56
57
58
59
60
61
62
63
64
65
66
67
68
69
70
71
72
73
74
75
76
77
78
79
80
81
82
83
84
85
86
87
88
89
90
91
92
93
94
95
96
97
98
99
100
101
102
103
104
105
106
107
108
109
110
111
112
113
114
115
116
117
118
119
120
121
122
123
124
125
126
127
128
129
130
131
132
133
134
135
136
137
138
139
140
141
142
143
144
145
146
147
148
149
150
151
152
153
154
155
156
157
158
159
160
161
162
163
164
165
166
167
168
169
170
171
172
173
174
175
176
177
178
179
180
181
182
183
184
185
186
187
188
189
190
191
192
193
194
195
196
197
198
199
200
201
202
203
204
205
206
207
208
209
210
211
212
213
214
215
216
217
218
219
220
221
222
223
224
225
226
227
228
229
230
231
232
233
234
235
236
237
238
239
240
241
242
243
244
245
246
247
248
249
250
251
252
253
254
255
256
257
258
259
260
261
262
263
264
265
266
267
268
269
270
271
272
273
274
275
276
277
278
279
280
281
282
283
284
285
286
287
288
289
290
291
292
293
294
295
296
297
298
299
300
301
302
303
304
305
306
307
308
309
310
311
312
313
314
315
316
317
318
319
320
321
322
323
324
325
326
327
328
329
330
331
332
333
334
335
336
337
338
339
340
341
342
343
344
345
346
347
348
349
350
351
352
353
354
355
356
357
358
359
360
361
362
363
364
365
366
367
368
369
370
371
372
373
374
375
376
377
378
379
380
381
382
383
384
385
386
387
388
389
390
391
392
393
394
395
396
397
398
399
400
401
402
403
404
405
406
407
408
409
410
411
412
413
414
415
416
417
418
419
420
421
422
423
424
425
426
427
428
429
430
431
432
433
434
435
436
437
438
439
440
441
442
443
444
445
446
447
448
449
450
451
452
453
454
455
456
457
458
459
460
461
462
463
464
465
466
467
468
469
470
471
472
473
474
475
476
477
478
479
480
481
482
483
484
485
486
487
488
489
490
491
492
493
494
495
496
497
498
499
500
501
502
503
504
505
506
507
508
509
510
511
512
513
514
515
516
517
518
519
520
|
from
typing
import
Counter
from
matplotlib
import
colors, markers
import
numpy as np
import
pandas as pd
import
operator
import
matplotlib.pyplot as plt
from
sklearn
import
tree
from
sklearn.model_selection
import
train_test_split
from
sklearn.ensemble
import
AdaBoostClassifier
from
sklearn.ensemble
import
RandomForestClassifier
from
sklearn.neighbors
import
KNeighborsClassifier
from
sklearn.neural_network
import
MLPClassifier
from
sklearn.svm
import
SVC
# 判断模型预测准确率的模型
from
sklearn.metrics
import
accuracy_score
from
sklearn.metrics
import
roc_auc_score
from
sklearn.metrics
import
f1_score
from
sklearn.metrics
import
classification_report
#设置绘图内的文字
plt.rcParams[
'font.family'
]
=
[
'sans-serif'
]
plt.rcParams[
'font.sans-serif'
]
=
[
'SimHei'
]
path
=
"C:\\Users\\zt\\Desktop\\winequality\\myexcel.xls"
# path=r"C:\\Users\\zt\\Desktop\\winequality\\winequality-red.csv"#您要读取的文件路径
# exceldata = np.loadtxt(
# path,
# dtype=str,
# delimiter=";",#每列数据的隔开标志
# skiprows=1
# )
# print(Counter(exceldata[:,-1]))
exceldata
=
pd.read_excel(path)
print
(exceldata)
print
(exceldata[exceldata.duplicated()])
print
(exceldata.duplicated().
sum
())
#去重
exceldata
=
exceldata.drop_duplicates()
#判空去空
print
(exceldata.isnull())
print
(exceldata.isnull().
sum
)
print
(exceldata[~exceldata.isnull()])
exceldata
=
exceldata[~exceldata.isnull()]
print
(Counter(exceldata[
"quality"
]))
#smote
#使用imlbearn库中上采样方法中的SMOTE接口
from
imblearn.over_sampling
import
SMOTE
#定义SMOTE模型,random_state相当于随机数种子的作用
X,y
=
np.split(exceldata,(
11
,),axis
=
1
)
smo
=
SMOTE(random_state
=
10
)
x_smo,y_smo
=
SMOTE().fit_resample(X.values,y.values)
print
(Counter(y_smo))
x_smo
=
pd.DataFrame({
"fixed acidity"
:x_smo[:,
0
],
"volatile acidity"
:x_smo[:,
1
],
"citric acid"
:x_smo[:,
2
] ,
"residual sugar"
:x_smo[:,
3
] ,
"chlorides"
:x_smo[:,
4
],
"free sulfur dioxide"
:x_smo[:,
5
] ,
"total sulfur dioxide"
:x_smo[:,
6
] ,
"density"
:x_smo[:,
7
],
"pH"
:x_smo[:,
8
] ,
"sulphates"
:x_smo[:,
9
] ,
" alcohol"
:x_smo[:,
10
]})
y_smo
=
pd.DataFrame({
"quality"
:y_smo})
print
(x_smo.shape)
print
(y_smo.shape)
#合并
exceldata
=
pd.concat([x_smo,y_smo],axis
=
1
)
print
(exceldata)
#分割X,y
X,y
=
np.split(exceldata,(
11
,),axis
=
1
)
X_train,X_test,y_train,y_test
=
train_test_split(X,y,random_state
=
10
,train_size
=
0.7
)
print
(
"训练集大小:%d"
%
(X_train.shape[
0
]))
print
(
"测试集大小:%d"
%
(X_test.shape[
0
]))
def
func_mlp(X_train,X_test,y_train,y_test):
print
(
"神经网络MLP:"
)
kk
=
[i
for
i
in
range
(
200
,
500
,
50
) ]
#迭代次数
t_precision
=
[]
t_recall
=
[]
t_accuracy
=
[]
t_f1_score
=
[]
for
n
in
kk:
method
=
MLPClassifier(activation
=
"tanh"
,solver
=
'lbfgs'
, alpha
=
1e
-
5
,
hidden_layer_sizes
=
(
5
,
2
), random_state
=
1
,max_iter
=
n)
method.fit(X_train,y_train)
MLPClassifier(activation
=
'relu'
, alpha
=
1e
-
05
, batch_size
=
'auto'
, beta_1
=
0.9
,
beta_2
=
0.999
, early_stopping
=
False
, epsilon
=
1e
-
08
,
hidden_layer_sizes
=
(
5
,
2
), learning_rate
=
'constant'
,
learning_rate_init
=
0.001
, max_iter
=
n, momentum
=
0.9
,
nesterovs_momentum
=
True
, power_t
=
0.5
, random_state
=
1
, shuffle
=
True
,
solver
=
'lbfgs'
, tol
=
0.0001
, validation_fraction
=
0.1
, verbose
=
False
,
warm_start
=
False
)
y_predict
=
method.predict(X_test)
t
=
classification_report(y_test, y_predict, target_names
=
[
'3'
,
'4'
,
'5'
,
'6'
,
'7'
,
'8'
],output_dict
=
True
)
print
(t)
t_accuracy.append(t[
"accuracy"
])
t_precision.append(t[
"weighted avg"
][
"precision"
])
t_recall.append(t[
"weighted avg"
][
"recall"
])
t_f1_score.append(t[
"weighted avg"
][
"f1-score"
])
plt.figure(
"数据未处理MLP"
)
plt.subplot(
2
,
2
,
1
)
#添加文本 #x轴文本
plt.xlabel(
'迭代次数'
)
#y轴文本
plt.ylabel(
'accuracy'
)
#标题
plt.title(
'不同迭代次数下的accuracy'
)
plt.plot(kk,t_accuracy,color
=
"r"
,marker
=
"o"
,lineStyle
=
"-"
)
plt.yticks(np.arange(
0
,
1
,
0.1
))
plt.subplot(
2
,
2
,
2
)
#添加文本 #x轴文本
plt.xlabel(
'迭代次数'
)
#y轴文本
plt.ylabel(
'precision'
)
#标题
plt.title(
'不同迭代次数下的precision'
)
plt.plot(kk,t_precision,color
=
"r"
,marker
=
"o"
,lineStyle
=
"-"
)
plt.yticks(np.arange(
0
,
1
,
0.1
))
plt.subplot(
2
,
2
,
3
)
#添加文本 #x轴文本
plt.xlabel(
'迭代次数'
)
#y轴文本
plt.ylabel(
'recall'
)
#标题
plt.title(
'不同迭代次数下的recall'
)
plt.plot(kk,t_recall,color
=
"r"
,marker
=
"o"
,lineStyle
=
"-"
)
plt.yticks(np.arange(
0
,
1
,
0.1
))
plt.subplot(
2
,
2
,
4
)
#添加文本 #x轴文本
plt.xlabel(
'迭代次数'
)
#y轴文本
plt.ylabel(
'f1_score'
)
#标题
plt.title(
'不同迭代次数下的f1_score'
)
plt.plot(kk,t_f1_score,color
=
"r"
,marker
=
"o"
,lineStyle
=
"-"
)
plt.yticks(np.arange(
0
,
1
,
0.1
))
plt.show()
def
func_svc(X_train,X_test,y_train,y_test):
print
(
"向量机:"
)
kk
=
[
"linear"
,
"poly"
,
"rbf"
]
#核函数类型
t_precision
=
[]
t_recall
=
[]
t_accuracy
=
[]
t_f1_score
=
[]
for
n
in
kk:
method
=
SVC(kernel
=
n, random_state
=
0
)
method
=
method.fit(X_train, y_train)
y_predic
=
method.predict(X_test)
t
=
classification_report(y_test, y_predic, target_names
=
[
'3'
,
'4'
,
'5'
,
'6'
,
'7'
,
'8'
],output_dict
=
True
)
print
(t)
t_accuracy.append(t[
"accuracy"
])
t_precision.append(t[
"weighted avg"
][
"precision"
])
t_recall.append(t[
"weighted avg"
][
"recall"
])
t_f1_score.append(t[
"weighted avg"
][
"f1-score"
])
plt.figure(
"数据未处理向量机"
)
plt.subplot(
2
,
2
,
1
)
#添加文本 #x轴文本
plt.xlabel(
'核函数类型'
)
#y轴文本
plt.ylabel(
'accuracy'
)
#标题
plt.title(
'不同核函数类型下的accuracy'
)
plt.plot(kk,t_accuracy,color
=
"r"
,marker
=
"o"
,lineStyle
=
"-"
)
plt.yticks(np.arange(
0
,
1
,
0.1
))
plt.subplot(
2
,
2
,
2
)
#添加文本 #x轴文本
plt.xlabel(
'核函数类型'
)
#y轴文本
plt.ylabel(
'precision'
)
#标题
plt.title(
'不同核函数类型下的precision'
)
plt.plot(kk,t_precision,color
=
"r"
,marker
=
"o"
,lineStyle
=
"-"
)
plt.yticks(np.arange(
0
,
1
,
0.1
))
plt.subplot(
2
,
2
,
3
)
#添加文本 #x轴文本
plt.xlabel(
'核函数类型'
)
#y轴文本
plt.ylabel(
'recall'
)
#标题
plt.title(
'不同核函数类型下的recall'
)
plt.plot(kk,t_recall,color
=
"r"
,marker
=
"o"
,lineStyle
=
"-"
)
plt.yticks(np.arange(
0
,
1
,
0.1
))
plt.subplot(
2
,
2
,
4
)
#添加文本 #x轴文本
plt.xlabel(
'核函数类型'
)
#y轴文本
plt.ylabel(
'f1_score'
)
#标题
plt.title(
'不同核函数类型下的f1_score'
)
plt.plot(kk,t_f1_score,color
=
"r"
,marker
=
"o"
,lineStyle
=
"-"
)
plt.yticks(np.arange(
0
,
1
,
0.1
))
plt.show()
def
func_classtree(X_train,X_test,y_train,y_test):
print
(
"决策树:"
)
kk
=
[
10
,
20
,
30
,
40
,
50
,
60
,
70
,
80
,
90
,
100
]
#决策树最大深度
t_precision
=
[]
t_recall
=
[]
t_accuracy
=
[]
t_f1_score
=
[]
for
n
in
kk:
method
=
tree.DecisionTreeClassifier(criterion
=
"gini"
,max_depth
=
n)
method.fit(X_train,y_train)
predic
=
method.predict(X_test)
print
(
"method.predict:%f"
%
method.score(X_test,y_test))
t
=
classification_report(y_test, predic, target_names
=
[
'3'
,
'4'
,
'5'
,
'6'
,
'7'
,
'8'
],output_dict
=
True
)
print
(t)
t_accuracy.append(t[
"accuracy"
])
t_precision.append(t[
"weighted avg"
][
"precision"
])
t_recall.append(t[
"weighted avg"
][
"recall"
])
t_f1_score.append(t[
"weighted avg"
][
"f1-score"
])
plt.figure(
"数据未处理决策树"
)
plt.subplot(
2
,
2
,
1
)
#添加文本 #x轴文本
plt.xlabel(
'决策树最大深度'
)
#y轴文本
plt.ylabel(
'accuracy'
)
#标题
plt.title(
'不同决策树最大深度下的accuracy'
)
plt.plot(kk,t_accuracy,color
=
"r"
,marker
=
"o"
,lineStyle
=
"-"
)
plt.yticks(np.arange(
0
,
1
,
0.1
))
plt.subplot(
2
,
2
,
2
)
#添加文本 #x轴文本
plt.xlabel(
'决策树最大深度'
)
#y轴文本
plt.ylabel(
'precision'
)
#标题
plt.title(
'不同决策树最大深度下的precision'
)
plt.plot(kk,t_precision,color
=
"r"
,marker
=
"o"
,lineStyle
=
"-"
)
plt.yticks(np.arange(
0
,
1
,
0.1
))
plt.subplot(
2
,
2
,
3
)
#添加文本 #x轴文本
plt.xlabel(
'决策树最大深度'
)
#y轴文本
plt.ylabel(
'recall'
)
#标题
plt.title(
'不同决策树最大深度下的recall'
)
plt.plot(kk,t_recall,color
=
"r"
,marker
=
"o"
,lineStyle
=
"-"
)
plt.yticks(np.arange(
0
,
1
,
0.1
))
plt.subplot(
2
,
2
,
4
)
#添加文本 #x轴文本
plt.xlabel(
'决策树最大深度'
)
#y轴文本
plt.ylabel(
'f1_score'
)
#标题
plt.title(
'不同决策树最大深度下的f1_score'
)
plt.plot(kk,t_f1_score,color
=
"r"
,marker
=
"o"
,lineStyle
=
"-"
)
plt.yticks(np.arange(
0
,
1
,
0.1
))
plt.show()
def
func_adaboost(X_train,X_test,y_train,y_test):
print
(
"提升树:"
)
kk
=
[
0.1
,
0.2
,
0.3
,
0.4
,
0.5
,
0.6
,
0.7
,
0.8
]
t_precision
=
[]
t_recall
=
[]
t_accuracy
=
[]
t_f1_score
=
[]
for
n
in
range
(
100
,
200
,
200
):
for
k
in
kk:
print
(
"迭代次数为:%d\n学习率:%.2f"
%
(n,k))
bdt
=
AdaBoostClassifier(tree.DecisionTreeClassifier(max_depth
=
2
, min_samples_split
=
20
),
algorithm
=
"SAMME"
,
n_estimators
=
n, learning_rate
=
k)
bdt.fit(X_train, y_train)
#迭代100次 ,学习率为0.1
y_pred
=
bdt.predict(X_test)
print
(
"训练集score:%lf"
%
(bdt.score(X_train,y_train)))
print
(
"测试集score:%lf"
%
(bdt.score(X_test,y_test)))
print
(bdt.feature_importances_)
t
=
classification_report(y_test, y_pred, target_names
=
[
'3'
,
'4'
,
'5'
,
'6'
,
'7'
,
'8'
],output_dict
=
True
)
print
(t)
t_accuracy.append(t[
"accuracy"
])
t_precision.append(t[
"weighted avg"
][
"precision"
])
t_recall.append(t[
"weighted avg"
][
"recall"
])
t_f1_score.append(t[
"weighted avg"
][
"f1-score"
])
plt.figure(
"数据未处理迭代100次(adaboost)"
)
plt.subplot(
2
,
2
,
1
)
#添加文本 #x轴文本
plt.xlabel(
'学习率'
)
#y轴文本
plt.ylabel(
'accuracy'
)
#标题
plt.title(
'不同学习率下的accuracy'
)
plt.plot(kk,t_accuracy,color
=
"r"
,marker
=
"o"
,lineStyle
=
"-"
)
plt.yticks(np.arange(
0
,
1
,
0.1
))
plt.subplot(
2
,
2
,
2
)
#添加文本 #x轴文本
plt.xlabel(
'学习率'
)
#y轴文本
plt.ylabel(
'precision'
)
#标题
plt.title(
'不同学习率下的precision'
)
plt.plot(kk,t_precision,color
=
"r"
,marker
=
"o"
,lineStyle
=
"-"
)
plt.yticks(np.arange(
0
,
1
,
0.1
))
plt.subplot(
2
,
2
,
3
)
#添加文本 #x轴文本
plt.xlabel(
'学习率'
)
#y轴文本
plt.ylabel(
'recall'
)
#标题
plt.title(
'不同学习率下的recall'
)
plt.plot(kk,t_recall,color
=
"r"
,marker
=
"o"
,lineStyle
=
"-"
)
plt.yticks(np.arange(
0
,
1
,
0.1
))
plt.subplot(
2
,
2
,
4
)
#添加文本 #x轴文本
plt.xlabel(
'学习率'
)
#y轴文本
plt.ylabel(
'f1_score'
)
#标题
plt.title(
'不同学习率下的f1_score'
)
plt.plot(kk,t_f1_score,color
=
"r"
,marker
=
"o"
,lineStyle
=
"-"
)
plt.yticks(np.arange(
0
,
1
,
0.1
))
plt.show()
# inX 用于分类的输入向量
# dataSet表示训练样本集
# 标签向量为labels,标签向量的元素数目和矩阵dataSet的行数相同
# 参数k表示选择最近邻居的数目
def
classify0(inx, data_set, labels, k):
"""实现k近邻"""
data_set_size
=
data_set.shape[
0
]
# 数据集个数,即行数
diff_mat
=
np.tile(inx, (data_set_size,
1
))
-
data_set
# 各个属性特征做差
sq_diff_mat
=
diff_mat
*
*
2
# 各个差值求平方
sq_distances
=
sq_diff_mat.
sum
(axis
=
1
)
# 按行求和
distances
=
sq_distances
*
*
0.5
# 开方
sorted_dist_indicies
=
distances.argsort()
# 按照从小到大排序,并输出相应的索引值
class_count
=
{}
# 创建一个字典,存储k个距离中的不同标签的数量
for
i
in
range
(k):
vote_label
=
labels[sorted_dist_indicies[i]]
# 求出第i个标签
# 访问字典中值为vote_label标签的数值再加1,
#class_count.get(vote_label, 0)中的0表示当为查询到vote_label时的默认值
class_count[vote_label[
0
]]
=
class_count.get(vote_label[
0
],
0
)
+
1
# 将获取的k个近邻的标签类进行排序
sorted_class_count
=
sorted
(class_count.items(),
key
=
operator.itemgetter(
1
), reverse
=
True
)
# 标签类最多的就是未知数据的类
return
sorted_class_count[
0
][
0
]
def
func_knn(X_train,X_test,y_train,y_test):
print
(
"k近邻:"
)
kk
=
[i
for
i
in
range
(
3
,
30
,
5
)]
#k的取值
t_precision
=
[]
t_recall
=
[]
t_accuracy
=
[]
t_f1_score
=
[]
for
n
in
kk:
y_predict
=
[]
for
x
in
X_test.values:
a
=
classify0(x, X_train.values, y_train.values, n)
# 调用k近邻分类
y_predict.append(a)
t
=
classification_report(y_test, y_predict, target_names
=
[
'3'
,
'4'
,
'5'
,
'6'
,
'7'
,
'8'
],output_dict
=
True
)
print
(t)
t_accuracy.append(t[
"accuracy"
])
t_precision.append(t[
"weighted avg"
][
"precision"
])
t_recall.append(t[
"weighted avg"
][
"recall"
])
t_f1_score.append(t[
"weighted avg"
][
"f1-score"
])
plt.figure(
"数据未处理k近邻"
)
plt.subplot(
2
,
2
,
1
)
#添加文本 #x轴文本
plt.xlabel(
'k值'
)
#y轴文本
plt.ylabel(
'accuracy'
)
#标题
plt.title(
'不同k值下的accuracy'
)
plt.plot(kk,t_accuracy,color
=
"r"
,marker
=
"o"
,lineStyle
=
"-"
)
plt.yticks(np.arange(
0
,
1
,
0.1
))
plt.subplot(
2
,
2
,
2
)
#添加文本 #x轴文本
plt.xlabel(
'k值'
)
#y轴文本
plt.ylabel(
'precision'
)
#标题
plt.title(
'不同k值下的precision'
)
plt.plot(kk,t_precision,color
=
"r"
,marker
=
"o"
,lineStyle
=
"-"
)
plt.yticks(np.arange(
0
,
1
,
0.1
))
plt.subplot(
2
,
2
,
3
)
#添加文本 #x轴文本
plt.xlabel(
'k值'
)
#y轴文本
plt.ylabel(
'recall'
)
#标题
plt.title(
'不同k值下的recall'
)
plt.plot(kk,t_recall,color
=
"r"
,marker
=
"o"
,lineStyle
=
"-"
)
plt.yticks(np.arange(
0
,
1
,
0.1
))
plt.subplot(
2
,
2
,
4
)
#添加文本 #x轴文本
plt.xlabel(
'k值'
)
#y轴文本
plt.ylabel(
'f1_score'
)
#标题
plt.title(
'不同k值下的f1_score'
)
plt.plot(kk,t_f1_score,color
=
"r"
,marker
=
"o"
,lineStyle
=
"-"
)
plt.yticks(np.arange(
0
,
1
,
0.1
))
plt.show()
def
func_randomforest(X_train,X_test,y_train,y_test):
print
(
"随机森林:"
)
t_precision
=
[]
t_recall
=
[]
t_accuracy
=
[]
t_f1_score
=
[]
kk
=
[
10
,
20
,
30
,
40
,
50
,
60
,
70
,
80
]
#默认树的数量
for
n
in
kk:
clf
=
RandomForestClassifier(n_estimators
=
n, max_depth
=
100
,min_samples_split
=
2
, random_state
=
10
,verbose
=
True
)
clf.fit(X_train,y_train)
predic
=
clf.predict(X_test)
print
(
"特征重要性:"
,clf.feature_importances_)
print
(
"acc:"
,clf.score(X_test,y_test))
t
=
classification_report(y_test, predic, target_names
=
[
'3'
,
'4'
,
'5'
,
'6'
,
'7'
,
'8'
],output_dict
=
True
)
print
(t)
t_accuracy.append(t[
"accuracy"
])
t_precision.append(t[
"weighted avg"
][
"precision"
])
t_recall.append(t[
"weighted avg"
][
"recall"
])
t_f1_score.append(t[
"weighted avg"
][
"f1-score"
])
plt.figure(
"数据未处理深度100(随机森林)"
)
plt.subplot(
2
,
2
,
1
)
#添加文本 #x轴文本
plt.xlabel(
'树的数量'
)
#y轴文本
plt.ylabel(
'accuracy'
)
#标题
plt.title(
'不同树的数量下的accuracy'
)
plt.plot(kk,t_accuracy,color
=
"r"
,marker
=
"o"
,lineStyle
=
"-"
)
plt.yticks(np.arange(
0
,
1
,
0.1
))
plt.subplot(
2
,
2
,
2
)
#添加文本 #x轴文本
plt.xlabel(
'树的数量'
)
#y轴文本
plt.ylabel(
'precision'
)
#标题
plt.title(
'不同树的数量下的precision'
)
plt.plot(kk,t_precision,color
=
"r"
,marker
=
"o"
,lineStyle
=
"-"
)
plt.yticks(np.arange(
0
,
1
,
0.1
))
plt.subplot(
2
,
2
,
3
)
#添加文本 #x轴文本
plt.xlabel(
'树的数量'
)
#y轴文本
plt.ylabel(
'recall'
)
#标题
plt.title(
'不同树的数量下的recall'
)
plt.plot(kk,t_recall,color
=
"r"
,marker
=
"o"
,lineStyle
=
"-"
)
plt.yticks(np.arange(
0
,
1
,
0.1
))
plt.subplot(
2
,
2
,
4
)
#添加文本 #x轴文本
plt.xlabel(
'树的数量'
)
#y轴文本
plt.ylabel(
'f1_score'
)
#标题
plt.title(
'不同树的数量下的f1_score'
)
plt.plot(kk,t_f1_score,color
=
"r"
,marker
=
"o"
,lineStyle
=
"-"
)
plt.yticks(np.arange(
0
,
1
,
0.1
))
plt.show()
if
__name__
=
=
'__main__'
:
#神经网络
print
(func_mlp(X_train,X_test,y_train,y_test))
#向量机
print
(func_svc(X_train,X_test,y_train,y_test))
#决策树
print
(func_classtree(X_train,X_test,y_train,y_test))
#提升树
print
(func_adaboost(X_train,X_test,y_train,y_test))
#knn
print
(func_knn(X_train,X_test,y_train,y_test))
#randomforest
print
(func_randomforest(X_train,X_test,y_train,y_test))
|
。
到此这篇关于Python实现机器学习算法的分类的文章就介绍到这了,更多相关Python算法分类内容请搜索我以前的文章或继续浏览下面的相关文章希望大家以后多多支持我! 。
原文链接:https://blog.csdn.net/qq_41934789/article/details/117400996 。
最后此篇关于Python实现机器学习算法的分类的文章就讲到这里了,如果你想了解更多关于Python实现机器学习算法的分类的内容请搜索CFSDN的文章或继续浏览相关文章,希望大家以后支持我的博客! 。
滑动窗口限流 滑动窗口限流是一种常用的限流算法,通过维护一个固定大小的窗口,在单位时间内允许通过的请求次数不超过设定的阈值。具体来说,滑动窗口限流算法通常包括以下几个步骤: 初始化:设置窗口
表达式求值:一个只有+,-,*,/的表达式,没有括号 一种神奇的做法:使用数组存储数字和运算符,先把优先级别高的乘法和除法计算出来,再计算加法和减法 int GetVal(string s){
【算法】前缀和 题目 先来看一道题目:(前缀和模板题) 已知一个数组A[],现在想要求出其中一些数字的和。 输入格式: 先是整数N,M,表示一共有N个数字,有M组询问 接下来有N个数,表示A[1]..
1.前序遍历 根-左-右的顺序遍历,可以使用递归 void preOrder(Node *u){ if(u==NULL)return; printf("%d ",u->val);
先看题目 物品不能分隔,必须全部取走或者留下,因此称为01背包 (只有不取和取两种状态) 看第一个样例 我们需要把4个物品装入一个容量为10的背包 我们可以简化问题,从小到大入手分析 weightva
我最近在一次采访中遇到了这个问题: 给出以下矩阵: [[ R R R R R R], [ R B B B R R], [ B R R R B B], [ R B R R R R]] 找出是否有任
我正在尝试通过 C++ 算法从我的 outlook 帐户发送一封电子邮件,该帐户已经打开并记录,但真的不知道从哪里开始(对于 outlook-c++ 集成),谷歌也没有帮我这么多。任何提示将不胜感激。
我发现自己像这样编写了一个手工制作的 while 循环: std::list foo; // In my case, map, but list is simpler auto currentPoin
我有用于检测正方形的 opencv 代码。现在我想在检测正方形后,代码运行另一个命令。 代码如下: #include "cv.h" #include "cxcore.h" #include "high
我正在尝试模拟一个 matlab 函数“imfill”来填充二进制图像(1 和 0 的二维矩阵)。 我想在矩阵中指定一个起点,并像 imfill 的 4 连接版本那样进行洪水填充。 这是否已经存在于
我正在阅读 Robert Sedgewick 的《C++ 算法》。 Basic recurrences section it was mentioned as 这种循环出现在循环输入以消除一个项目的递
我正在思考如何在我的日历中生成代表任务的数据结构(仅供我个人使用)。我有来自 DBMS 的按日期排序的任务记录,如下所示: 买牛奶(18.1.2013) 任务日期 (2013-01-15) 任务标签(
输入一个未排序的整数数组A[1..n]只有 O(d) :(d int) 计算每个元素在单次迭代中出现在列表中的次数。 map 是balanced Binary Search Tree基于确保 O(nl
我遇到了一个问题,但我仍然不知道如何解决。我想出了如何用蛮力的方式来做到这一点,但是当有成千上万的元素时它就不起作用了。 Problem: Say you are given the followin
我有一个列表列表。 L1= [[...][...][.......].......]如果我在展平列表后获取所有元素并从中提取唯一值,那么我会得到一个列表 L2。我有另一个列表 L3,它是 L2 的某个
我们得到二维矩阵数组(假设长度为 i 和宽度为 j)和整数 k我们必须找到包含这个或更大总和的最小矩形的大小F.e k=7 4 1 1 1 1 1 4 4 Anwser是2,因为4+4=8 >= 7,
我实行 3 类倒制,每周换类。顺序为早类 (m)、晚类 (n) 和下午类 (a)。我固定的订单,即它永远不会改变,即使那个星期不工作也是如此。 我创建了一个函数来获取 ISO 周数。当我给它一个日期时
假设我们有一个输入,它是一个元素列表: {a, b, c, d, e, f} 还有不同的集合,可能包含这些元素的任意组合,也可能包含不在输入列表中的其他元素: A:{e,f} B:{d,f,a} C:
我有一个子集算法,可以找到给定集合的所有子集。原始集合的问题在于它是一个不断增长的集合,如果向其中添加元素,我需要再次重新计算它的子集。 有没有一种方法可以优化子集算法,该算法可以从最后一个计算点重新
我有一个包含 100 万个符号及其预期频率的表格。 我想通过为每个符号分配一个唯一(且前缀唯一)的可变长度位串来压缩这些符号的序列,然后将它们连接在一起以表示序列。 我想分配这些位串,以使编码序列的预

我是一名优秀的程序员,十分优秀!