- ubuntu12.04环境下使用kvm ioctl接口实现最简单的虚拟机
- Ubuntu 通过无线网络安装Ubuntu Server启动系统后连接无线网络的方法
- 在Ubuntu上搭建网桥的方法
- ubuntu 虚拟机上网方式及相关配置详解
CFSDN坚持开源创造价值,我们致力于搭建一个资源共享平台,让每一个IT人在这里找到属于你的精彩世界.
这篇CFSDN的博客文章Matplotlib.pyplot 三维绘图的实现示例由作者收集整理,如果你对这篇文章有兴趣,记得点赞哟.
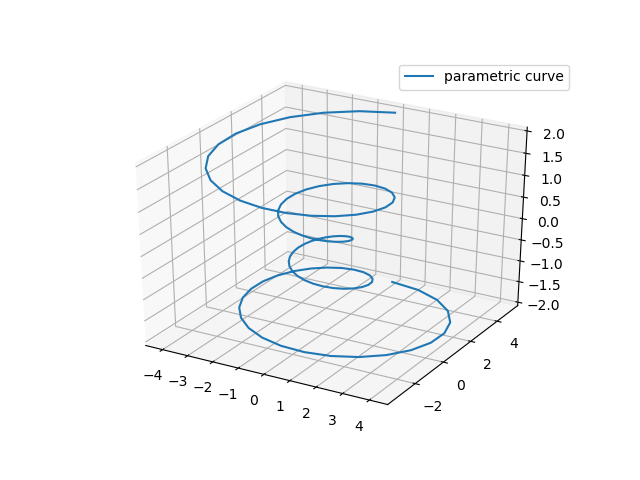
折线图 。
Axes3D.plot(xs,ys,*args,**kwargs) 。
。
| Argument | Description |
|---|---|
| xs, ys | x, y coordinates of vertices |
| zs | z value(s), either one for all points or one for each point. |
| zdir | Which direction to use as z (‘x', ‘y' or ‘z') when plotting a 2D set. |
。
|
1
2
3
4
5
6
7
8
9
10
11
12
13
14
15
16
17
18
|
import
matplotlib as mpl
from
mpl_toolkits.mplot3d
import
Axes3D
import
numpy as np
import
matplotlib.pyplot as plt
mpl.rcParams[
'legend.fontsize'
]
=
10
fig
=
plt.figure()
ax
=
fig.gca(projection
=
'3d'
)
theta
=
np.linspace(
-
4
*
np.pi,
4
*
np.pi,
100
)
z
=
np.linspace(
-
2
,
2
,
100
)
r
=
z
*
*
2
+
1
x
=
r
*
np.sin(theta)
y
=
r
*
np.cos(theta)
ax.plot(x, y, z, label
=
'parametric curve'
)
ax.legend()
plt.show()
|
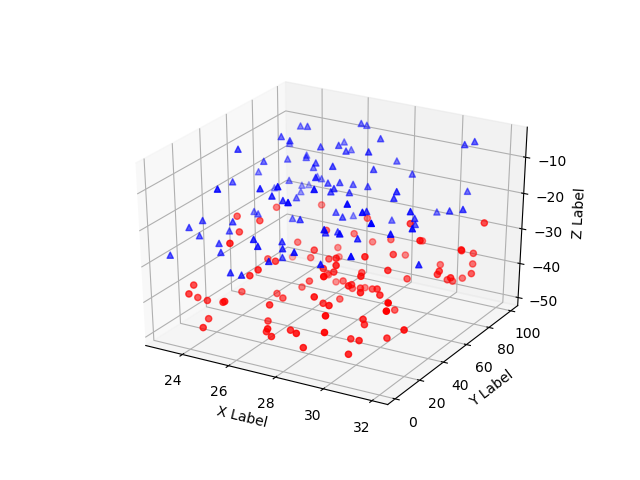
散点图 。
Axes3D.scatter(xs,ys,zs=0,zdir='z',s=20,c=None,depthshade=True,*args,**kwargs) 。
。
| Argument | Description |
|---|---|
| xs, ys | Positions of data points. |
| zs | Either an array of the same length as xs and ys or a single value to place all points in the same plane. Default is 0. |
| zdir | Which direction to use as z (‘x', ‘y' or ‘z') when plotting a 2D set. |
| s | Size in points^2. It is a scalar or an array of the same length as x and y. |
| c | A color. c can be a single color format string, or a sequence of color specifications of length N, or a sequence of N numbers to be mapped to colors using the cmap and norm specified via kwargs (see below). Note that c should not be a single numeric RGB or RGBA sequence because that is indistinguishable from an array of values to be colormapped. c can be a 2-D array in which the rows are RGB or RGBA, however, including the case of a single row to specify the same color for all points. |
| depthshade | Whether or not to shade the scatter markers to give the appearance of depth. Default is True. |
。
|
1
2
3
4
5
6
7
8
9
10
11
12
13
14
15
16
17
18
19
20
21
22
23
24
25
26
27
28
29
30
31
|
from
mpl_toolkits.mplot3d
import
Axes3D
import
matplotlib.pyplot as plt
import
numpy as np
def
randrange(n, vmin, vmax):
'''
Helper function to make an array of random numbers having shape (n, )
with each number distributed Uniform(vmin, vmax).
'''
return
(vmax
-
vmin)
*
np.random.rand(n)
+
vmin
fig
=
plt.figure()
ax
=
fig.add_subplot(
111
, projection
=
'3d'
)
n
=
100
# For each set of style and range settings, plot n random points in the box
# defined by x in [23, 32], y in [0, 100], z in [zlow, zhigh].
for
c, m, zlow, zhigh
in
[(
'r'
,
'o'
,
-
50
,
-
25
), (
'b'
,
'^'
,
-
30
,
-
5
)]:
xs
=
randrange(n,
23
,
32
)
ys
=
randrange(n,
0
,
100
)
zs
=
randrange(n, zlow, zhigh)
ax.scatter(xs, ys, zs, c
=
c, marker
=
m)
ax.set_xlabel(
'X Label'
)
ax.set_ylabel(
'Y Label'
)
ax.set_zlabel(
'Z Label'
)
plt.show()
|
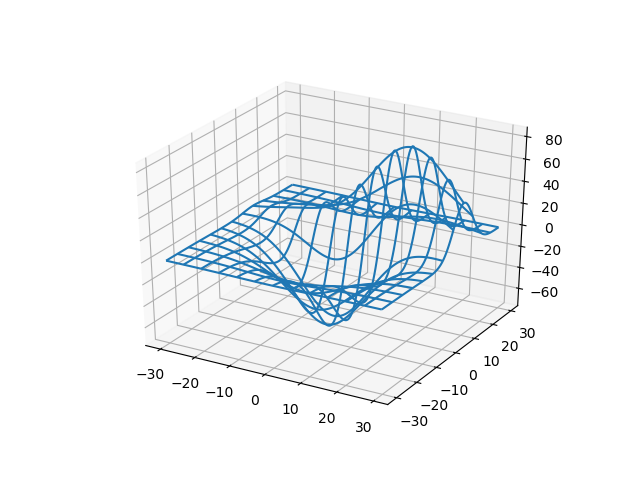
线框图 。
Axes3D.plot_wireframe(X,Y,Z,*args,**kwargs) 。
。
| Argument | Description |
|---|---|
| X, Y, | Data values as 2D arrays |
| Z | |
| rstride | Array row stride (step size), defaults to 1 |
| cstride | Array column stride (step size), defaults to 1 |
| rcount | Use at most this many rows, defaults to 50 |
| ccount | Use at most this many columns, defaults to 50 |
。
|
1
2
3
4
5
6
7
8
9
10
11
12
13
|
from
mpl_toolkits.mplot3d
import
axes3d
import
matplotlib.pyplot as plt
fig
=
plt.figure()
ax
=
fig.add_subplot(
111
, projection
=
'3d'
)
# Grab some test data.
X, Y, Z
=
axes3d.get_test_data(
0.05
)
# Plot a basic wireframe.
ax.plot_wireframe(X, Y, Z, rstride
=
10
, cstride
=
10
)
plt.show()
|
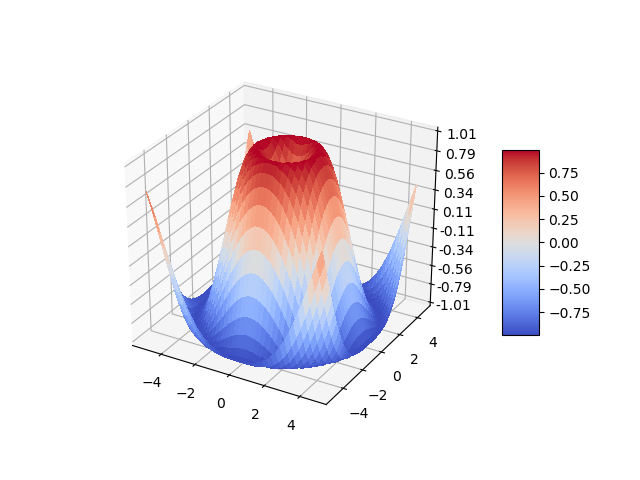
表面图 。
Axes3D.plot_surface(X,Y,Z,*args,**kwargs) 。
。
| Argument | Description |
|---|---|
| X, Y, Z | Data values as 2D arrays |
| rstride | Array row stride (step size) |
| cstride | Array column stride (step size) |
| rcount | Use at most this many rows, defaults to 50 |
| ccount | Use at most this many columns, defaults to 50 |
| color | Color of the surface patches |
| cmap | A colormap for the surface patches. |
| facecolors | Face colors for the individual patches |
| norm | An instance of Normalize to map values to colors |
| vmin | Minimum value to map |
| vmax | Maximum value to map |
| shade | Whether to shade the facecolors |
。
|
1
2
3
4
5
6
7
8
9
10
11
12
13
14
15
16
17
18
19
20
21
22
23
24
25
26
27
28
29
|
from
mpl_toolkits.mplot3d
import
Axes3D
import
matplotlib.pyplot as plt
from
matplotlib
import
cm
from
matplotlib.ticker
import
LinearLocator, FormatStrFormatter
import
numpy as np
fig
=
plt.figure()
ax
=
fig.gca(projection
=
'3d'
)
# Make data.
X
=
np.arange(
-
5
,
5
,
0.25
)
Y
=
np.arange(
-
5
,
5
,
0.25
)
X, Y
=
np.meshgrid(X, Y)
R
=
np.sqrt(X
*
*
2
+
Y
*
*
2
)
Z
=
np.sin(R)
# Plot the surface.
surf
=
ax.plot_surface(X, Y, Z, cmap
=
cm.coolwarm,
linewidth
=
0
, antialiased
=
False
)
# Customize the z axis.
ax.set_zlim(
-
1.01
,
1.01
)
ax.zaxis.set_major_locator(LinearLocator(
10
))
ax.zaxis.set_major_formatter(FormatStrFormatter(
'%.02f'
))
# Add a color bar which maps values to colors.
fig.colorbar(surf, shrink
=
0.5
, aspect
=
5
)
plt.show()
|
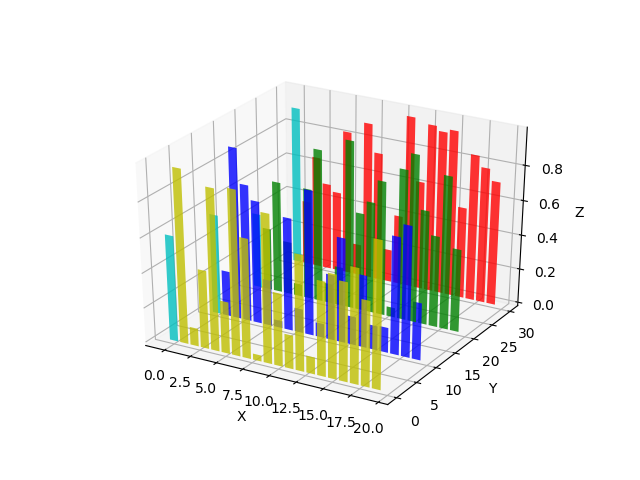
柱状图 。
Axes3D.bar(left,height,zs=0,zdir='z',*args,**kwargs) 。
。
| Argument | Description |
|---|---|
| left | The x coordinates of the left sides of the bars. |
| height | The height of the bars. |
| zs | Z coordinate of bars, if one value is specified they will all be placed at the same z. |
| zdir | Which direction to use as z (‘x', ‘y' or ‘z') when plotting a 2D set. |
。
|
1
2
3
4
5
6
7
8
9
10
11
12
13
14
15
16
17
18
19
20
21
|
from
mpl_toolkits.mplot3d
import
Axes3D
import
matplotlib.pyplot as plt
import
numpy as np
fig
=
plt.figure()
ax
=
fig.add_subplot(
111
, projection
=
'3d'
)
for
c, z
in
zip
([
'r'
,
'g'
,
'b'
,
'y'
], [
30
,
20
,
10
,
0
]):
xs
=
np.arange(
20
)
ys
=
np.random.rand(
20
)
# You can provide either a single color or an array. To demonstrate this,
# the first bar of each set will be colored cyan.
cs
=
[c]
*
len
(xs)
cs[
0
]
=
'c'
ax.bar(xs, ys, zs
=
z, zdir
=
'y'
, color
=
cs, alpha
=
0.8
)
ax.set_xlabel(
'X'
)
ax.set_ylabel(
'Y'
)
ax.set_zlabel(
'Z'
)
plt.show()
|
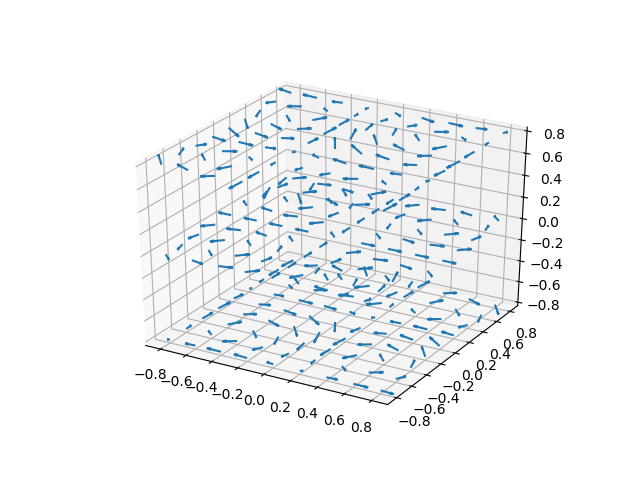
箭头图 。
Axes3D.quiver(*args,**kwargs) 。
Arguments
X, Y, Z: The x, y and z coordinates of the arrow locations (default is tail of arrow; see pivot kwarg) U, V, W: The x, y and z components of the arrow vectors 。
|
1
2
3
4
5
6
7
8
9
10
11
12
13
14
15
16
17
18
19
20
21
|
from
mpl_toolkits.mplot3d
import
axes3d
import
matplotlib.pyplot as plt
import
numpy as np
fig
=
plt.figure()
ax
=
fig.gca(projection
=
'3d'
)
# Make the grid
x, y, z
=
np.meshgrid(np.arange(
-
0.8
,
1
,
0.2
),
np.arange(
-
0.8
,
1
,
0.2
),
np.arange(
-
0.8
,
1
,
0.8
))
# Make the direction data for the arrows
u
=
np.sin(np.pi
*
x)
*
np.cos(np.pi
*
y)
*
np.cos(np.pi
*
z)
v
=
-
np.cos(np.pi
*
x)
*
np.sin(np.pi
*
y)
*
np.cos(np.pi
*
z)
w
=
(np.sqrt(
2.0
/
3.0
)
*
np.cos(np.pi
*
x)
*
np.cos(np.pi
*
y)
*
np.sin(np.pi
*
z))
ax.quiver(x, y, z, u, v, w, length
=
0.1
, normalize
=
True
)
plt.show()
|
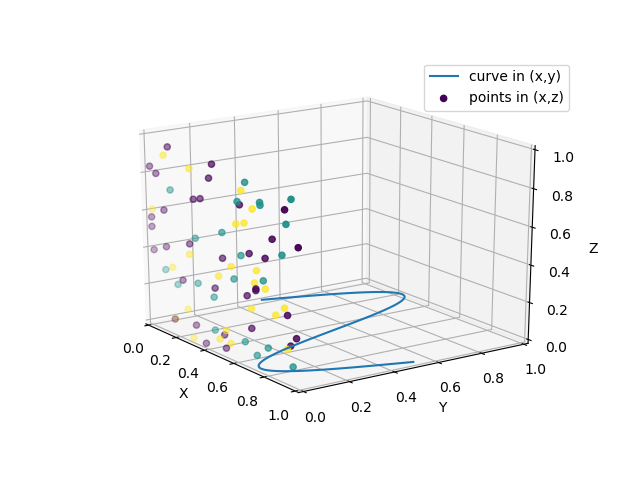
2D转3D图 。
|
1
2
3
4
5
6
7
8
9
10
11
12
13
14
15
16
17
18
19
20
21
22
23
24
25
26
27
28
29
30
31
32
33
34
35
36
|
from
mpl_toolkits.mplot3d
import
Axes3D
import
numpy as np
import
matplotlib.pyplot as plt
fig
=
plt.figure()
ax
=
fig.gca(projection
=
'3d'
)
# Plot a sin curve using the x and y axes.
x
=
np.linspace(
0
,
1
,
100
)
y
=
np.sin(x
*
2
*
np.pi)
/
2
+
0.5
ax.plot(x, y, zs
=
0
, zdir
=
'z'
, label
=
'curve in (x,y)'
)
# Plot scatterplot data (20 2D points per colour) on the x and z axes.
colors
=
(
'r'
,
'g'
,
'b'
,
'k'
)
x
=
np.random.sample(
20
*
len
(colors))
y
=
np.random.sample(
20
*
len
(colors))
labels
=
np.random.randint(
3
, size
=
80
)
# By using zdir='y', the y value of these points is fixed to the zs value 0
# and the (x,y) points are plotted on the x and z axes.
ax.scatter(x, y, zs
=
0
, zdir
=
'y'
, c
=
labels, label
=
'points in (x,z)'
)
# Make legend, set axes limits and labels
ax.legend()
ax.set_xlim(
0
,
1
)
ax.set_ylim(
0
,
1
)
ax.set_zlim(
0
,
1
)
ax.set_xlabel(
'X'
)
ax.set_ylabel(
'Y'
)
ax.set_zlabel(
'Z'
)
# Customize the view angle so it's easier to see that the scatter points lie
# on the plane y=0
ax.view_init(elev
=
20.
, azim
=
-
35
)
plt.show()
|
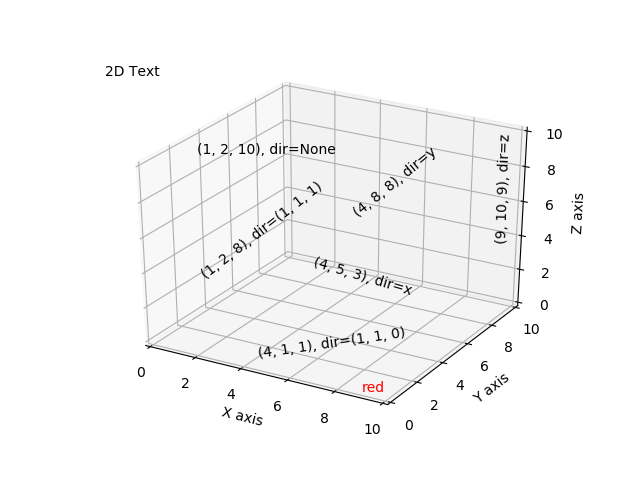
文本图 。
|
1
2
3
4
5
6
7
8
9
10
11
12
13
14
15
16
17
18
19
20
21
22
23
24
25
26
27
28
29
30
31
32
33
|
from
mpl_toolkits.mplot3d
import
Axes3D
import
matplotlib.pyplot as plt
fig
=
plt.figure()
ax
=
fig.gca(projection
=
'3d'
)
# Demo 1: zdir
zdirs
=
(
None
,
'x'
,
'y'
,
'z'
, (
1
,
1
,
0
), (
1
,
1
,
1
))
xs
=
(
1
,
4
,
4
,
9
,
4
,
1
)
ys
=
(
2
,
5
,
8
,
10
,
1
,
2
)
zs
=
(
10
,
3
,
8
,
9
,
1
,
8
)
for
zdir, x, y, z
in
zip
(zdirs, xs, ys, zs):
label
=
'(%d, %d, %d), dir=%s'
%
(x, y, z, zdir)
ax.text(x, y, z, label, zdir)
# Demo 2: color
ax.text(
9
,
0
,
0
,
"red"
, color
=
'red'
)
# Demo 3: text2D
# Placement 0, 0 would be the bottom left, 1, 1 would be the top right.
ax.text2D(
0.05
,
0.95
,
"2D Text"
, transform
=
ax.transAxes)
# Tweaking display region and labels
ax.set_xlim(
0
,
10
)
ax.set_ylim(
0
,
10
)
ax.set_zlim(
0
,
10
)
ax.set_xlabel(
'X axis'
)
ax.set_ylabel(
'Y axis'
)
ax.set_zlabel(
'Z axis'
)
plt.show()
|
3D拼图 。
|
1
2
3
4
5
6
7
8
9
10
11
12
13
14
15
16
17
18
19
20
21
22
23
24
25
26
27
28
29
30
31
32
33
34
35
36
|
import
matplotlib.pyplot as plt
from
mpl_toolkits.mplot3d.axes3d
import
Axes3D, get_test_data
from
matplotlib
import
cm
import
numpy as np
# set up a figure twice as wide as it is tall
fig
=
plt.figure(figsize
=
plt.figaspect(
0.5
))
# ===============
# First subplot
# ===============
# set up the axes for the first plot
ax
=
fig.add_subplot(
1
,
2
,
1
, projection
=
'3d'
)
# plot a 3D surface like in the example mplot3d/surface3d_demo
X
=
np.arange(
-
5
,
5
,
0.25
)
Y
=
np.arange(
-
5
,
5
,
0.25
)
X, Y
=
np.meshgrid(X, Y)
R
=
np.sqrt(X
*
*
2
+
Y
*
*
2
)
Z
=
np.sin(R)
surf
=
ax.plot_surface(X, Y, Z, rstride
=
1
, cstride
=
1
, cmap
=
cm.coolwarm,
linewidth
=
0
, antialiased
=
False
)
ax.set_zlim(
-
1.01
,
1.01
)
fig.colorbar(surf, shrink
=
0.5
, aspect
=
10
)
# ===============
# Second subplot
# ===============
# set up the axes for the second plot
ax
=
fig.add_subplot(
1
,
2
,
2
, projection
=
'3d'
)
# plot a 3D wireframe like in the example mplot3d/wire3d_demo
X, Y, Z
=
get_test_data(
0.05
)
ax.plot_wireframe(X, Y, Z, rstride
=
10
, cstride
=
10
)
plt.show()
|
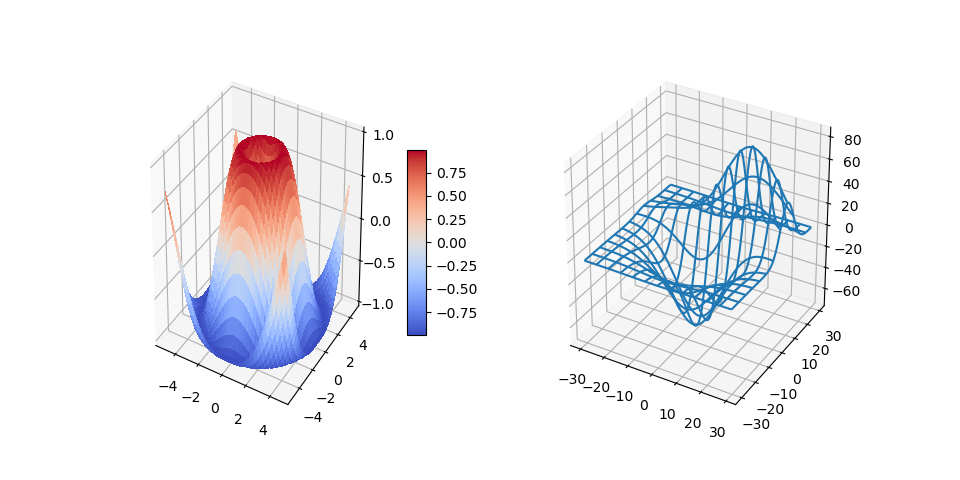
到此这篇关于Matplotlib.pyplot 三维绘图的实现示例的文章就介绍到这了,更多相关Matplotlib.pyplot 三维绘图内容请搜索我以前的文章或继续浏览下面的相关文章希望大家以后多多支持我! 。
原文链接:https://www.cnblogs.com/wuwen19940508/p/8638266.html 。
最后此篇关于Matplotlib.pyplot 三维绘图的实现示例的文章就讲到这里了,如果你想了解更多关于Matplotlib.pyplot 三维绘图的实现示例的内容请搜索CFSDN的文章或继续浏览相关文章,希望大家以后支持我的博客! 。
背景: 我最近一直在使用 JPA,我为相当大的关系数据库项目生成持久层的轻松程度给我留下了深刻的印象。 我们公司使用大量非 SQL 数据库,特别是面向列的数据库。我对可能对这些数据库使用 JPA 有一
我已经在我的 maven pom 中添加了这些构建配置,因为我希望将 Apache Solr 依赖项与 Jar 捆绑在一起。否则我得到了 SolarServerException: ClassNotF
interface ITurtle { void Fight(); void EatPizza(); } interface ILeonardo : ITurtle {
我希望可用于 Java 的对象/关系映射 (ORM) 工具之一能够满足这些要求: 使用 JPA 或 native SQL 查询获取大量行并将其作为实体对象返回。 允许在行(实体)中进行迭代,并在对当前
好像没有,因为我有实现From for 的代码, 我可以转换 A到 B与 .into() , 但同样的事情不适用于 Vec .into()一个Vec . 要么我搞砸了阻止实现派生的事情,要么这不应该发
在 C# 中,如果 A 实现 IX 并且 B 继承自 A ,是否必然遵循 B 实现 IX?如果是,是因为 LSP 吗?之间有什么区别吗: 1. Interface IX; Class A : IX;
就目前而言,这个问题不适合我们的问答形式。我们希望答案得到事实、引用资料或专业知识的支持,但这个问题可能会引发辩论、争论、投票或扩展讨论。如果您觉得这个问题可以改进并可能重新打开,visit the
我正在阅读标准haskell库的(^)的实现代码: (^) :: (Num a, Integral b) => a -> b -> a x0 ^ y0 | y0 a -> b ->a expo x0
我将把国际象棋游戏表示为 C++ 结构。我认为,最好的选择是树结构(因为在每个深度我们都有几个可能的移动)。 这是一个好的方法吗? struct TreeElement{ SomeMoveType
我正在为用户名数据库实现字符串匹配算法。我的方法采用现有的用户名数据库和用户想要的新用户名,然后检查用户名是否已被占用。如果采用该方法,则该方法应该返回带有数据库中未采用的数字的用户名。 例子: “贾
我正在尝试实现 Breadth-first search algorithm , 为了找到两个顶点之间的最短距离。我开发了一个 Queue 对象来保存和检索对象,并且我有一个二维数组来保存两个给定顶点
我目前正在 ika 中开发我的 Python 游戏,它使用 python 2.5 我决定为 AI 使用 A* 寻路。然而,我发现它对我的需要来说太慢了(3-4 个敌人可能会落后于游戏,但我想供应 4-
我正在寻找 Kademlia 的开源实现C/C++ 中的分布式哈希表。它必须是轻量级和跨平台的(win/linux/mac)。 它必须能够将信息发布到 DHT 并检索它。 最佳答案 OpenDHT是
我在一本书中读到这一行:-“当我们要求 C++ 实现运行程序时,它会通过调用此函数来实现。” 而且我想知道“C++ 实现”是什么意思或具体是什么。帮忙!? 最佳答案 “C++ 实现”是指编译器加上链接
我正在尝试使用分支定界的 C++ 实现这个背包问题。此网站上有一个 Java 版本:Implementing branch and bound for knapsack 我试图让我的 C++ 版本打印
在很多情况下,我需要在 C# 中访问合适的哈希算法,从重写 GetHashCode 到对数据执行快速比较/查找。 我发现 FNV 哈希是一种非常简单/好/快速的哈希算法。但是,我从未见过 C# 实现的
目录 LRU缓存替换策略 核心思想 不适用场景 算法基本实现 算法优化
1. 绪论 在前面文章中提到 空间直角坐标系相互转换 ,测绘坐标转换时,一般涉及到的情况是:两个直角坐标系的小角度转换。这个就是我们经常在测绘数据处理中,WGS-84坐标系、54北京坐标系
在软件开发过程中,有时候我们需要定时地检查数据库中的数据,并在发现新增数据时触发一个动作。为了实现这个需求,我们在 .Net 7 下进行一次简单的演示. PeriodicTimer .
二分查找 二分查找算法,说白了就是在有序的数组里面给予一个存在数组里面的值key,然后将其先和数组中间的比较,如果key大于中间值,进行下一次mid后面的比较,直到找到相等的,就可以得到它的位置。

我是一名优秀的程序员,十分优秀!