- Java锁的逻辑(结合对象头和ObjectMonitor)
- 还在用饼状图?来瞧瞧这些炫酷的百分比可视化新图形(附代码实现)⛵
- 自动注册实体类到EntityFrameworkCore上下文,并适配ABP及ABPVNext
- 基于Sklearn机器学习代码实战
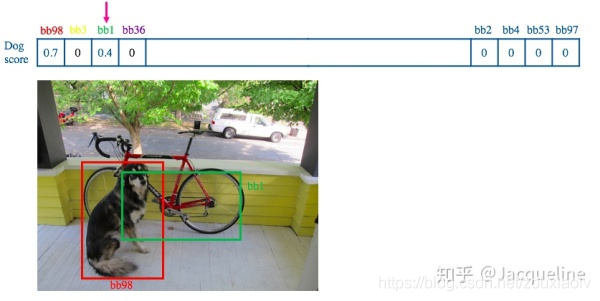
NMS(non maximum suppression)即非极大值抑制,广泛应用于传统的特征提取和深度学习的目标检测算法中。 NMS原理是通过筛选出局部极大值得到最优解。 在2维边缘提取中体现在提取边缘轮廓后将一些梯度方向变化率较小的点筛选掉,避免造成干扰。 在三维关键点检测中也起到重要作用,筛选掉特征中非局部极值。 在目标检测方面,无论是One-stage的SSD系列算法、YOLO系列算法还是Two-stage的基于RCNN系列的算法,非极大值抑制都是其中必不可少的一个组件,可以将较小分数的输出框过滤掉,同样,在三维基于点云的目标检测模型中亦有使用.
在现有的基于anchor的目标检测算法中,都会产生数量巨大的候选矩形框,这些矩形框有很多是指向同一目标,因此就存在大量冗余的候选矩形框。非极大值抑制算法的目的正在于此,它可以消除多余的框,找到最佳的物体检测位置.
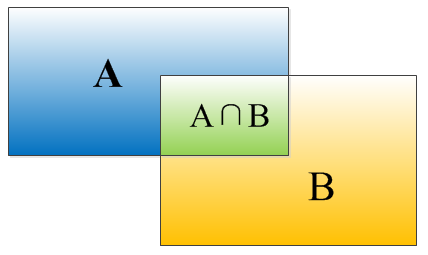
IoU(Intersection over Union) :定位精度评价公式。 相当于两个区域交叉的部分除以两个区域的并集部分得出的结果。 IoU各个取值时的情况展示,一般来说,这个 Score > 0.5 就可以被认为一个不错的结果了.

如何计算IoU(交并比) 。
选取两个矩形框左顶角的横,纵坐标的最大值,x21,y21;选取两个矩形框右下边角的横纵坐标的最小值,x12,y12,


                          #!/usr/bin/env python3
# -*- coding: utf-8 -*-
"""
NMS function(Non-Maximum Suppression,  抑制不是极大值的元素)
        psedocode:
            1. choose the highest score element  a_1  in set B, add a_1 to the keep set C
            2. compute the IOU between the chosen element(such as a_1) and others elements in set B
            3. only keep the nums  at set B whose IOU value is less than thresholds (can be set as >=0.5), delete the nums similiar
                to a_1(the higher IOU it is , the more interseciton between a_1 and it will have)
            4. choose the highest score value a_2 left at set B  and add a_2 to set C
            5. repeat the 2-4 until  there is nothing in set B, while set C is the NMS value set

"""
import numpy as np

# boxes表示人脸框的xywh4点坐标+相关置信度
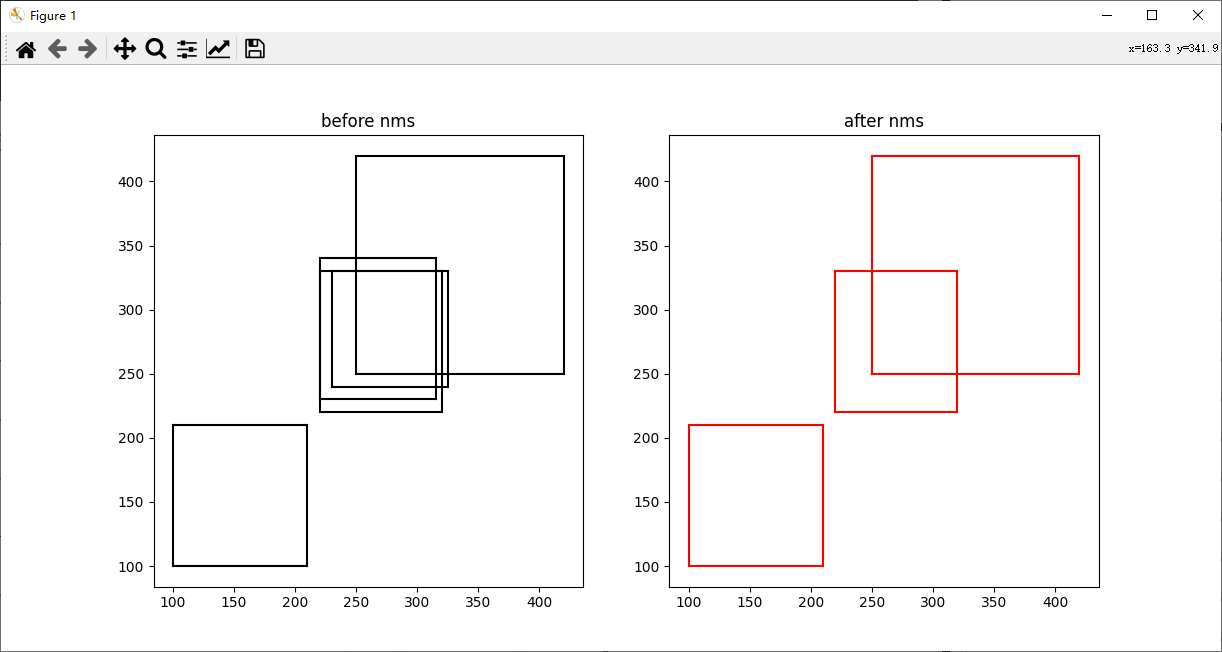
boxes = np.array([[100, 100, 210, 210, 0.72],
                  [250, 250, 420, 420, 0.8],
                  [220, 220, 320, 330, 0.92],
                  [230, 240, 325, 330, 0.81],
                  [220, 230, 315, 340, 0.9]])


def py_cpu_nms(dets, thresh):
    # dets:(m,5)  thresh:scaler

    x1 = dets[:, 0]  # [100. 250. 220. 230. 220.]
    y1 = dets[:, 1]  # [100. 250. 220. 240. 230.]
    x2 = dets[:, 2]  # [210. 420. 320. 325. 315.]
    y2 = dets[:, 3]  # [210. 420. 330. 330. 340.]

    areas = (y2 - y1 + 1) * (x2 - x1 + 1)
    scores = dets[:, 4]  # [0 1 3 4 2]
    keep = []
    # index表示按照scores从高到底的相关box的序列号
    index = scores.argsort()[::-1]  # [2 4 3 1 0]

    while index.size > 0:
        print("sorted index of boxes according to scores", index)
        # 选择得分最高的score直接加入keep列表中
        i = index[0]
        keep.append(i)
        # 计算score最高的box和其他box分别的相关交集坐标
        x11 = np.maximum(x1[i], x1[index[1:]])  # [220. 230. 250. 220.]  最高的被提走了,所以要从1开始取后 4位
        y11 = np.maximum(y1[i], y1[index[1:]])  # [230. 240. 250. 220.]
        x22 = np.minimum(x2[i], x2[index[1:]])  # [315. 320. 320. 210.]
        y22 = np.minimum(y2[i], y2[index[1:]])  # [330. 330. 330. 210.]

        print("x1 values by original order:", x1)
        print("x1 value by scores:", x1[index[:]])  #  [220. 220. 230. 250. 100.]
        print("x11 value means  replacing the less value compared" \
              " with the value by the largest score :", x11)
        # 计算交集面积
        w = np.maximum(0, x22 - x11 + 1)  # the weights of overlap
        h = np.maximum(0, y22 - y11 + 1)  # the height of overlap
        overlaps = w * h
        # 计算相关IOU值(交集面积/并集面积,表示边框重合程度,越大表示越相似,越该删除)
        # 重叠面积 /(面积1+面积2-重叠面积)
        ious = overlaps / (areas[i] + areas[index[1:]] - overlaps)
        # 只保留iou小于阈值的索引号,重复上步
        idx = np.where(ious <= thresh)[0]
        # 因为第一步index[0]已经被划走,所以需要原来的索引号需要多加一
        index = index[idx + 1]

    return keep


import matplotlib.pyplot as plt


def plot_bbox(ax, dets, c='b', title_name="title"):
    x1 = dets[:, 0]
    y1 = dets[:, 1]
    x2 = dets[:, 2]
    y2 = dets[:, 3]

    ax.plot([x1, x2], [y1, y1], c)
    ax.plot([x1, x1], [y1, y2], c)
    ax.plot([x1, x2], [y2, y2], c)
    ax.plot([x2, x2], [y1, y2], c)
    ax.set_title(title_name)


if __name__ == '__main__':
    # 1.创建画板fig
    fig = plt.figure(figsize=(12, 6))

    # 参数解释,前两个参数 1,2 表示创建了一个一行两列的框 第三个参数表示当前所在的框
    ax1 = fig.add_subplot(1, 2, 1)
    ax2 = fig.add_subplot(1, 2, 2)

    plot_bbox(ax1, boxes, 'k', title_name="before nms")  # before nms

    keep = py_cpu_nms(boxes, thresh=0.7)

    plot_bbox(ax2, boxes[keep], 'r', title_name="after nms")  # after nms
    plt.show()

参考文献: https://blog.csdn.net/weixin_42237113/article/details/105743296 https://blog.csdn.net/lz867422770/article/details/100019587 。
最后此篇关于非极大值抑制(NMS)算法详解的文章就讲到这里了,如果你想了解更多关于非极大值抑制(NMS)算法详解的内容请搜索CFSDN的文章或继续浏览相关文章,希望大家以后支持我的博客! 。
在 Windows 世界中,什么是正确的名称。具有导出函数的老式 C++ DLL?不是 COM DLL,也不是 .NET DLL。我们以前通过调用 LoadLibrary() 和 GetProcAdd
目前我正在使用javaEE7,我有一个场景如下。在我的 JSF Web 应用程序中,我有一个事件监听器(不是 JSF 事件),当事件调用时,它会执行某些操作,然后将这些信息更新到我的 Web 应用程序
这不是 AJAX 请求/响应回调问题... 我正在使用 Dojo 1.5 构建网格。我正在尝试 dojo.connect具有功能的扩展/收缩按钮。我的问题是 grid.startup()在创建实际 D
非 Webkit Opera 是 very specific在某些功能中,因此通常通过 JavaScript 检测到 the following way . 但是,Opera Next 几乎是 Goo
我已查看以下链接中给出的所有日志,但未能找到 IP 地址: https://developer.couchbase.com/documentation/server/3.x/admin/Misc/Tr
我有一个命令行程序,它根据一组源文件生成一个我想在我的 Android gradle 构建 (A) 中使用的 jar 文件。这个命令行程序只是将一个 jar 文件存储在磁盘上的一个目录中。 我如何创建
下面的 htaccess 命令将所有非 www 转移到 http www RewriteEngine On RewriteCond %{HTTP_HOST} !^www\. RewriteRule ^
我正在使用自定义链接器脚本将内核镜像分为两部分。第一个是普通代码和数据,第二个是初始化代码和不再需要时将被丢弃的数据。初始化部分也不像内核本身那样在地址空间之间共享,因此如果 fork() 仍然存在(
这个问题在这里已经有了答案: Several unary operators in C and C++ (3 个答案) What is the "-->" operator in C++? (29
假设我有一个类设置如下: class A { public: virtual void foo() { printf("default implementation\n"); } }; c
#include using namespace std; int main(int argc, char *argv[]) { int i=-5; while(~(i)) {
近期,百度搜索引擎变化无常,很多企业站、行业站、门户站、论坛等站点遭到了降权,特别是比比贴分类信息网直接遭到了拔毛,这对于广大站长来说是一种打击,也是各个企业、行业的打击。 至今,很多网站已经恢复
我现在正在使用 IBM TPM v1332 + IBM TSS v1470 并尝试将一些基本关键字/密码存储到 TPM 上的非 volatile 内存中。我找到了两种方法。一种是创建一个密封对象并使用
我的 PHP 脚本中有一个正则表达式,如下所示: /(\b$term|$term\b)(?!([^)/iu 这与 $term 中包含的单词匹配,只要前后有单词边界并且它不在 HTML 标记内即可。 但
我想显示用户名称地址(请参阅 www.ipchicken.com ),但我唯一能找到的是 IP 地址。我尝试了反向查找,但也没有用: IPAddress ip = IPAddress.Parse(th
只有 UI 线程能够显示到屏幕上,还是其他线程也可以这样做? 最佳答案 不,您只能直接从 UI 线程访问 UI,但您可以编码来自其他线程的结果,例如使用 Control.Invoke 或 contro
我正在使用现代 Excel 滚动条(不是旧的 ActiveX 类型,即开发人员 > 插入 > 表单控件 > 滚动条)并且想检测它的值何时更改。我找不到有关此类对象的更改事件的任何信息。您可以在单击时分
当我使用这段代码时 IE 6 确实正确使用了指定的样式表,但所有其他浏览器在应该使用基本上声明的样式表时会忽略这两种样式表,如果您不是 IE,请使用此样式表。 有什么想法吗? 最佳答案 n
我想指定 2 mssql 表之间的关系。 付款类别和付款。 paymentcategory.id 加入 payout.category 列。 在 payout.json 模型中 我指定为外键:id,
我正在尝试制作非 volatile UDF,但似乎不可能。因此,这是我非常简单的test-UDF: Option Explicit Dim i As Integer Sub Main() i = 0

我是一名优秀的程序员,十分优秀!